An obvious question for carbon credits is whether they work.
Do they reduce carbon emissions, resulting in lower carbon dioxide in the atmosphere, and therefore, contribute to cooling of the planet rather than runaway heating?
Carbon credits and associated carbon markets were valued at US$104 billion in 2024 [1]. That means there is a huge amount of financial resources available to certain groups of humans that are working at something in the world (power, resource attainment, belonging, food, safety to name a few common human needs). Even a basic understanding shows that there is more to carbon credits than just emissions.
With this in mind, let’s ask the question backwards. What do carbon credits work at?
Do they work at…
…. really reducing Carbon Emissions?
The story of carbon credits is that they were created for this very purpose, to reduce total human related carbon emissions into the atmosphere.
Let’s take the EU ETS here since many studies have tried to decide if the EU ETS genuinely works at CO2 reduction.
The table [from 2, 3] summarises some of the research.
| AUTHOR | TIME FRAME | COUNTRY | RESEARCH CONCLUSION |
| Ellerman et al (2008) | 2005-06 | EU | Emissions reduced by 130-220MtCO2 |
| Anderson et al (2011) | 2005-07 | EU | Emissions reduced by 247MtCO2 |
| Egenhofer et al (2011) | 2006-09 | EU | Emissions intensity reduced 3.65% average per year |
| Jaraite et al (2016) | 2003-10 | Lithuania | No reduction in emissions, slight reduction intensity |
| Bayer et al (2020) | 2008-16 | EU | Emissions reduced by 8.1-11.5% |
| Klemetsen et al (2020) | 2001-13 | Norway | Weak effect on emissions reduction |
| Dechezlepêtre et al (2023) | 2005-14 | France, UK, Netherlands, Norway | Emissions reduced around 10% |
| Colmer (2024) | 1996-12 | France | Firms reduced emissions by 14-16% |
| Calel (2020) | 2005-12 | UK | No reduction on emissions |
| Zimmermanova et al (2019) | 2005-16 | EU | Emissions reduction found |
| Biancalani et al (2024) | 2005-20 | EU | Emissions reduced by 15.4% [3] |
| Kilimko et al (2025) | 2005-22 | EU | Emissions reduced by 42.8% |
There is evidence that the EU ETS has reduced emissions although the quantified impact depends on the time frame of the research, the country/countries involved and the the economic sectors studied.
There is a general trend that emissions reduced or emissions intensity reduced on a range of 8% – 42.8%. Klimko’s estimate looks very high compared to other reports. Apart from Klimko et al, I’m surprised at how small the estimated reductions are given that the EU ETS has been around for 20 years.
It is difficult to be categorical here and because the EU has 27 different countries and there are known issues with EU ETS. Such as the cap was set too high; there were too many ‘free passes’; not all sectors of the economy were included. Plus other carbon reducing measures are in existence, like taxes and legislation, and the policy push for economic growth to support a European lifestyle that has historically been destructive to climate stability, is still at work.
Let’s not forget that the EU ETS by itself has a carbon footprint.
Carbon dioxide and its equivalent greenhouse gases are generated through the development and use of digital devices and networks, administrative processes, monitoring, reporting, verification, and market operations of the EU ETS. At date of this post I couldn’t find, unsurprisingly, an analysis of the carbon footprint of the EU ETS. Unsurprising because it would be a massive undertaking to do so. But if the EU ETS is unable to account for the CO2 generated by its existence, studies on the observed or estimated emissions reductions correlated to the EU ETS is like only looking at one side of the carbon ledger. We need to look at both sides of the ledger to understand the total impact of carbon credits on atmospheric carbon.
With a some success of carbon credits on emissions and absence of a footprint, it seems to me that the EU ETS is working somewhat at emissions reduction but a lot more on something else.
…Creativity?
Carbon credits and their regulatory and voluntary carbon markets were created by humans.
This sounds obvious, but let’s take a minute to marvel at the sheer creativity at work in a carbon credit.
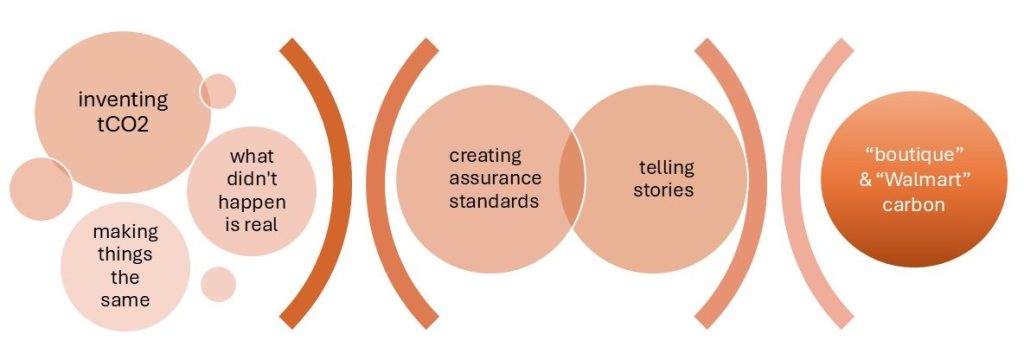
First came the invention of a tonne of carbon dioxide. This started with the idea of a Global Warming Potential (GWP) created by scientists in the late 1980s for a single comparable measure across different greenhouse gases [4]. This search for measures of equivalent comparison won’t be a surprise to those of us in global health since the World Health Organization constantly seeks measures of likeness and comparability between very different health systems across the globe.
A single measure of GWP meant that scientists could craft different future scenarios for global warming and these eventually found their way into the Intergovernmental Panel on Climate Change assessment reports. This ‘making different things the same’ was important for the development of carbon markets. Negotiations between governments (through the Kyoto Protocol and Marrakesh Accord) built on the GWP and invented ‘emission reductions units’ (ERU) and ‘certified emission reductions’ that could be exchanged and traded. These negotiations ultimately translated a scientific and national way of accounting for carbon into one that could become mutually interchangeable for money through a market [4].
Thus, a tonne of CO2 (tCO2) was born.
The creation of a tCO2 unit “set up a sort of conceptual path dependence” [4] for others to follow: using the tCO2 as the basis for their units. Units from Australia, EU, New Zealand, China… and Verified Emissions Reductions from carbon reduction projects. So, the idea of a tCO2 proliferated, mainly through negotiations between governments just after the Kyoto Protocol was adopted.
At the same time, financial sector techniques were transferred to carbon markets (in other words, bringing together two ideas that hadn’t been previously mixed). Financial instruments could be invented through the marriage of tCO2 and financial ‘products’ (like futures, options and swaps). These products are not carbon ‘itself’ but are based on the purchase and sale of a ‘right to emit’/’promise to not emit’ [4].
Having invented a tCO2, how can you be sure a tonne is a tonne? A critical making-stuff-real element has been the creation of assurance standards – the invention of certificates, audits, verification methodologies and tracking systems (inventories, transaction logs and registries). In cap+trade carbon markets, the EU collects and manages information from participating company emissions over time and, equally important, establish a counterfactual – a claim about what the emissions would be without reducing emissions. In other words, establish that a ‘what-didn’t-happen’ is real. This requires “an enormous imaginative exercise” to create a baseline – imagining future carbon emissions without the reduction and various scenarios for what might happen to carbon emissions within a carbon reduction project – from planned activities (e.g., a windfarm) and taking into account what others might do in response [4].
All of this imagination ends up with a simple unit of carbon from very different social and ecological places. And the simplicity of the unit enables two kinds of carbon-as-a-commodity to be traded in a market: Boutique and Walmart. Stories make carbon boutique – stories of community, strong relationships, ecological and social co-benefits: the place where carbon credits are ‘made’ is shown as real and romanticised [5]. Alternatively, Walmart carbon is a price point on the computer screen of a financial broker, showing carbon price changes and highly restricted range of information (e.g., range of requests for sales or purchases) [4].
AMAZING!
Whether you love carbon credits or hate them… the sheer ingenuity, invention, and imagination involved in their existence is, I think, a witness to enduring human creativity.
…Deception?
However, what has all this creativity been deployed for?
In Voluntary Carbon Markets, some of the world’s most profitable – and most polluting companies – have invested in carbon credits that are “likely junk” [6]. A review of 2,346 greenhouse gas mitigation projects [7] estimated that less than 16% of the credits issued were real emission reductions.
Different types of carbon project show different rates of reduction [7]:
- 11% for cookstoves;
- 16% for SF6, known as Sulphur Hexafluoride, a synthetic and potent greenhouse gas primarily used in electricity generation;
- 25% for avoided deforestation;
- 68% for HFC-23, also known as Fluoroform, significantly more climate warming that carbon dixoide;
- no statistically significant emission reductions from wind power and improved forest management projects.
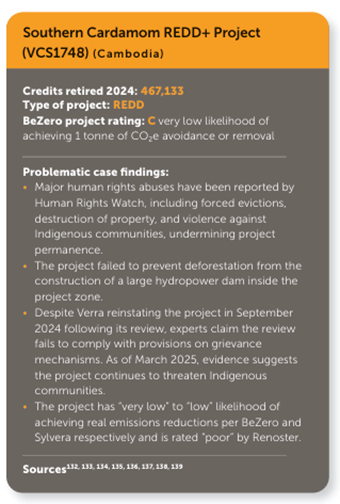
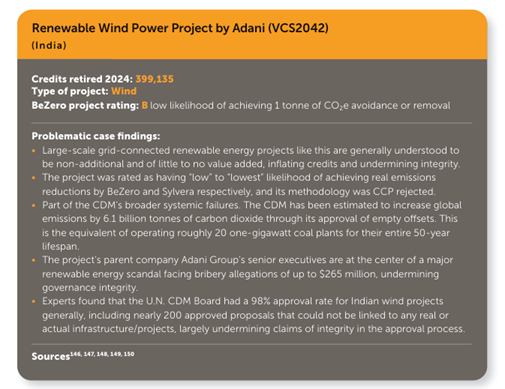
Two examples of deception in carbon projects [6] are given below:
Carbon credit projects should follow five rules:
- Establish a Counterfactual baseline: a what-didn’t-happen;
- Identify Leakage: did the project reduce carbon here but increase it over there (i.e. outside of the project);
- Identify Durability: how long will carbon be stored and what are the risks it will be released again;
- Count Carbon: use a robust method for monitoring and calculating carbon. For example, if the project was forestry, then carbon held in trees, soils, other forest flora and wood products and generated by logging, forest management and trees themselves;
- Be Additional: would the project have occurred if there was no carbon credit to sell?
How these criteria pan out in reality depends on the type and rigour of a carbon credit project.
Forests are a popular carbon credit project – so let’s take a look at these criteria with respect to forestry.
BASELINES are usually set once at the beginning of the project. There are many ways to deflate or inflate a baseline because the project creator is the only one who knows what would have happened without the carbon credit project. The “true” baseline (counterfactual) cannot be seen because it didn’t happen.
For instance, a voluntary carbon credit forest management project in Canada assumed that a different forest owner would have aggressively logged the forest compared to the current owner who did not. In other words, the project owner chose a counterfactual (a what-didn’t-happen) that created many more carbon credits than if the chosen counterfactual was a sustainable forest alternative [8].
Or real estate investment trusts buy standing forests then aggressively cut down trees to sell the timber and later sells the land to carbon project developers. The carbon project developers can report a low baseline carbon sequestered (held) in the land because trees were recently cut down there [9].
LEAKAGE. In forest projects, one way leakage can take place is when an owner of the carbon credit project isn’t using staff and money to cut down trees and rather uses these to buy and log forests somewhere else. Many projects deduct credits from their projects based on a specified leakage rate. The rate applied, when and how it is applied can vary but it’s complicated because you are trying to put a number on what will happen in the future, what others will do, and how you will respond to what they do. Scope for deception here would be much less if baselines were more realistic [10].
DURABILITY. Carbon stored in forests and their ecosystems is temporary. It can be released through fire, drought, disease, and wind, as well as human activities. Forest carbon credit projects have to take account of the risk of ‘reversal’ – carbon that is held in trees being released. Carbon registries usually have an insurance pool (of trees) if such events occur. But even the longest forest carbon projects (100 years) are not permanent. So, you aren’t neutralizing emissions rather you are delaying them. And in a context of increasing global heating, with greatly increased number of forest fires over wider areas, the risk of reversal keeps increasing. If your voluntary carbon credits are in a registry that has low quality carbon credits (i.e. not reducing carbon or actually increasing it) then the risk of wildfires is accelerated so the buffer doesn’t amount to insurance at all [10].
CARBON ACCOUNTING methods to measure and estimate the carbon held in a forest, its soils, plants, and wood products are time-consuming. Carbon in a forest cannot be seen so instead is predicted using a mathematical relationship called Allometric Equations. These work by using variables you can measure (e.g., diameter of a tree) that are known to be proportionally related to another tree variable that is difficult to measure (e.g., metric tons of carbon). Changes in the amount of carbon held in a forest over time is checked at different time intervals. But remember – forest carbon sold as a carbon credit is not the carbon in the forest at the beginning of a project rather a promise that more carbon will be stored in the future.
Even done with sincere intent, measuring carbon in any project is difficult. The Verra registry has “come under intense scrutiny over multiple years for its repeated integrity concerns. Allegations include weak methodologies and accounting loopholes … (that) were being used to avoid stricter regulations” [6].
ADDITIONALITY means that there should have been a large change compared to a business-as-usual scenario. Some carbon registries combine additionality and baseline so that any positive change from the baseline is de facto additional, while others separate baseline setting from the question of additionality. For example, a forest conservation carbon project in Colombia claimed additionality through its baseline (i.e. claimed to protect forests that would otherwise have been felled) but “over 97% of the project area overlap(ped) with protected Indigenous lands …that already contain(ed) safeguards for preserving forests” [6].
Where does this leave us?
By taking a (somewhat) deeper dive into forest carbon projects, it becomes clear that even with the many factors working in your favour such as,
- sufficient time;
- appropriate expertise;
- greatest of positive intentions;
- satisfactory budget…
…it is logically impossible to accurately state the carbon sequestered in a forest or any other carbon project. Even the best managed carbon projects have numerous chances to overestimate credits, double count, and ultimately fail to contribute to reduced carbon emissions.
The complexity of carbon credits makes deception easier.
Carbon markets taken as a whole constitute enormous work, but a company that doesn’t want to do the hard work can take a short cut by buying junk carbon credits and claim entry to the ‘net-zero community’. The carbon market, then, distributes responsibility across a range of actors and enables free riders to benefit, at greatly reduced cost, from the work of wider others. It reminds me of government indecision at the start of COVID – no Health Minister wanted to take responsibility for a decision.
Conclusion
Carbon credits tend to feature as climate hero or climate villain, but they are so much more than that.
There is evidence that cap+trade carbon markets can somewhat reduce greenhouse gas emissions but without foot-printing, only half the story is told. And much more research demonstrates that carbon credits are exercises in deception.
But the sheer creativity that is deployed in the interests of deception (‘I-don’t-wanna-change’) is still very intriguing. The evidence suggests that voluntary carbon markets are greenwashing and regulated carbon markets potentially so. Yet deception is part of being in, and staying in, a community. I have previously said that greenwashing is part of belonging. And since belonging is such an important fundamental need for humans, it deserves a blog post of its own (here).
Practically, if you wanted to use carbon credits to reduce your organizational pollution footprint, their use could only be valid if you have already made systematic efforts to reduce carbon across your organisation. If you have made yourself accountable to very specific plans, clear starting actions for how you would do so, based on already measured and reported emissions. If you report regularly on what you have done and what reductions you have achieved – and if you make sure that all your claims can be independently verified [11].
References
[1] World Bank (2025) State and Trends of Carbon Pricing 2025. Washington, DC: World Bank.
[2] Klimko et al (20250 The Impact Of The Eu Ets On Greenhouse Gas Emissions In The EU from 2005 To 2022 Economics & Environment https://doi.org/10.34659/eis.2025.92.1.874
[3] Biancalani et al (2024) The Impact Of The European Union Emissions Trading System On Carbon Dioxide Emissions: A Matrix Completion Analysis Nature https://doi.org/10.1038/s41598-024-70260-6
[4] Paterson et al (2012): Virtuous Carbon Environmental Politics http://dx.doi.org/10.1080/09644016.2012.688354
[5] Huff (2023) Frictitious Commodities: Virtuality, Virtue And Value In The Carbon Economy Of Repair Nature & Space http://doi.org/10.1177/25148486211015056
[6] Jackson et al (2025) Built to Fail? World’s Largest Carbon Offset Projects Unlikely To Deliver Promised Emissions Reductions Despite Reforms Corporate Accountability
[7] Probst et al (2024) Systematic Assessment Of The Achieved Emission Reductions Of Carbon Crediting Projects Nature Communicationshttps://doi.org/10.1038/s41467-024-53645-z
[8] van Kooten et al (2015). Forest Carbon Offsets Revisited: Shedding Light On Darkwoods. Forest Science https://doi.org/10.5849/forsci.13-183
[9] Gifford (2020). “You Can’t Value What You Can’t Measure”: A Critical Look At Forest Carbon Accounting. Climate Change http://doi.org/10.1007/s10584-020-02653-1
[10] Haya et al (2023) Comprehensive Review Of Carbon Quantification By Improved Forest Management Offset Protocols Frontiers in Forests & Global Change https://doi.org/10.3389/ffgc.2023.958879 [11] Trouwloon et al (2023) Understanding the Use of Carbon Credits by Companies: A Review of the Defining Elements of Corporate Climate Claims Global Challenges https://doi.org/10.1002/gch2.202200158